Problem
High-dimensional forecasts hide why models win or fail across related series, time windows, and covariates.
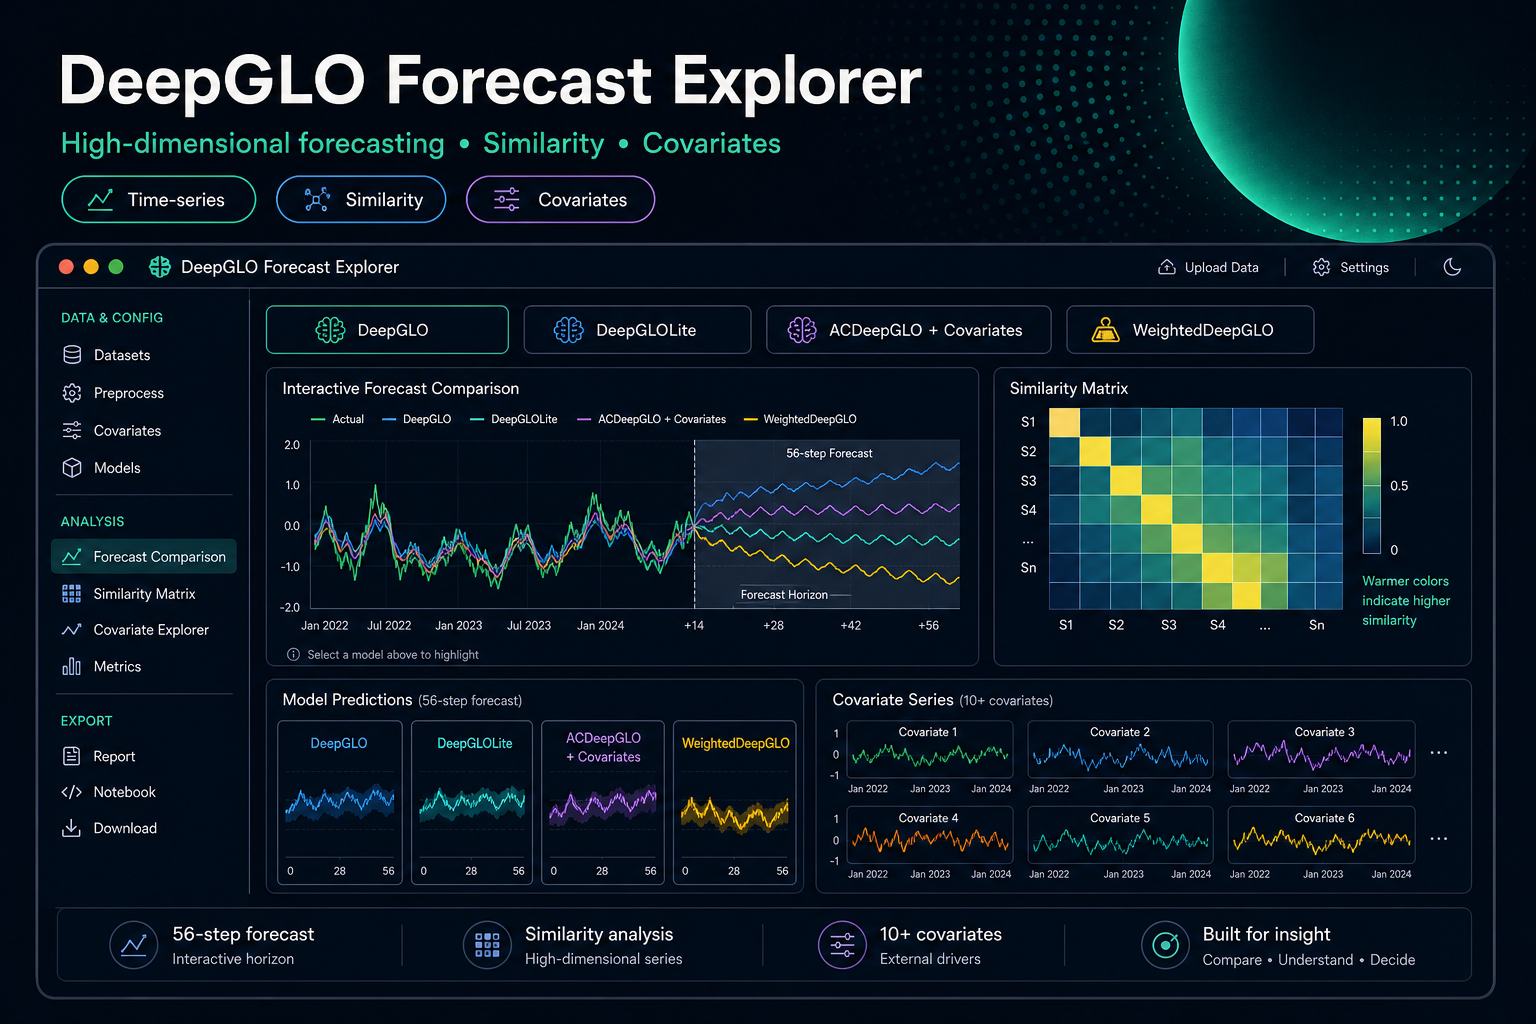
Interactive exploration of high-dimensional forecasting and inter-series similarity (React + D3 frontend, Flask backend).
This project is a React + Flask web application built to help users visually compare four variants of RNN-based, high-dimensional time-series forecasting inspired by the DeepGLO line of methods. It is designed for interactive, model-to-model analysis: instead of only reporting aggregate metrics, the tool makes it easy to inspect where and why a given model wins (or fails) across time and across related series.
The core idea is to combine: (1) forecasting overlays (per model), (2) an explicit view of inter-series dependence (similarity) over time, and (3) rapid iteration on dataset / settings through a single backend endpoint that trains/validates and returns predictions for visualization.
High-dimensional forecasts hide why models win or fail across related series, time windows, and covariates.
A React, D3, and Flask explorer compares model variants, dependence structure, covariates, and rolling validation outputs.
Model evaluation becomes more useful when practitioners can inspect behavior across slices, not just aggregate scores.
Demonstrates evaluation and diagnostic UX depth that transfers directly to agent reliability and monitoring work.
Use this as technical proof while reviewing reliability engagement options.
Send a problem briefThe system is organized as a thin, interactive client with a single backend entrypoint. Pre-packaged datasets such as traffic, electricity, PEMS, wiki are used for experimentation. The Flask server slices the data to a manageable subset of series and time window by default to keep the interaction loop responsive.
The app compares four forecasting variants that share the same general goal—accurate forecasts for many related series—while differing in how they handle global structure, efficiency, and covariate usage:
In high-dimensional forecasting, accuracy is only part of the story: practitioners also need to understand dependency, stability over time, and failure modes. This tool turns that need into a concrete workflow—letting users inspect forecasts, compare variants, and connect errors back to inter-series structure in an interactive, visual way.